 Editor’s Note: It is my pleasure to introduce a new GTDtimes Contributor, Venkatesh Rao. Venkat works at the Xerox Innovation Group, where he leads technology projects that aim to invent the future of documents and information work.
Prior to Xerox, he spent 2.5 years as a postdoc at Cornell, in Raff D’Andrea’s robotics research group. His work at Cornell was on Air Force command and control models for future battlefields. Between 1997-2003, he was at the University of Michigan, working on his PhD, which was on aircraft and spacecraft formation dynamics, with Pierre Kabamba.
His home discipline is systems and control theory, but for inspiration and ideas he draws from all the decision sciences including OR and AI. More of Venkat’s work can be found at his personal weblog, Ribbonfarm.
Recalibrating Your GTD Systems
(adapted version of an article I originally posted on my personal blog, ribbonfarm.com. GTD newbies might want to start with the for-dummies level companion piece I just posted there, before tackling this one.)
Here’s a great holiday-season project for you GTD enthusiasts looking to improve your systems: recalibration. If you pull this off, your New Year’s resolutions might actually be more than a ritual in 2009. Your GTD system is really just a complex feedback control system, like your car’s cruise control or your thermostat. And like every system that depends on measurement, it needs occasional recalibration. So this article aims to show you how you can recalibrate your own systems, using my own efforts as a case study. It begins with the fundamental question, can you measure information work? The short answer: yes. Here is a graph, based on real data, showing the real cumulative quantity of information work in my life during two years and some months of my life, between January 2004 and about March 2006.
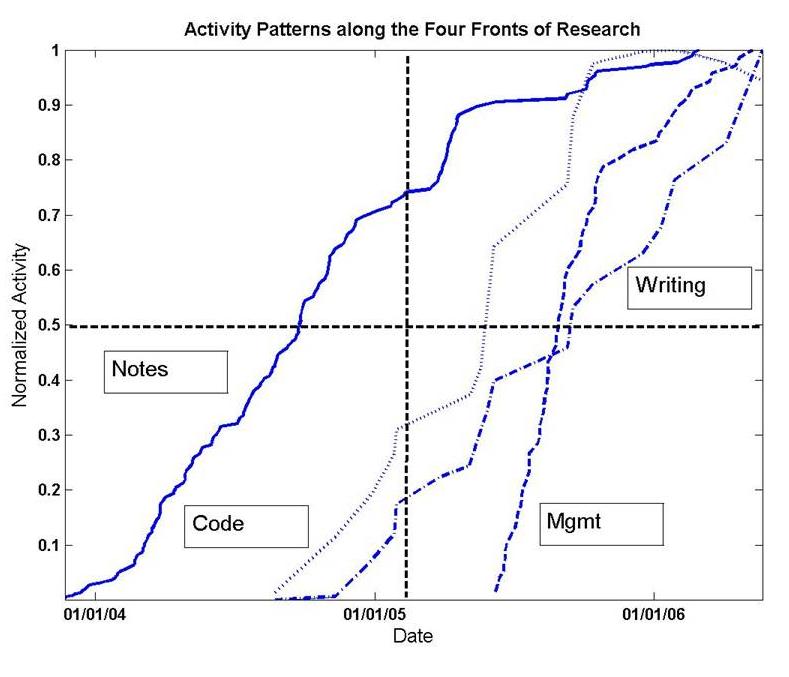
Figure 1: Quantity of work over one year
Calibrating Work in the Raw
The first thing you’ve got to understand about measuring information work is that at the ground level, one size does not fit all. There are ways to abstract away from the specific nature of your work, which I’ll get to, but you still need to understand it first. The measurement methods I’ll talk about later rely on data artifacts generated by meta-work (like GTD lists). But meta-stuff must be calibrated against what it talks about. A typical next-step in your life may be an hour long, while one in my life may be five minutes. You won’t know until you look.
Every sort of information work transforms some sort of information artifact into some other sort of information artifact. Paul Erdos famously defined mathematics as the process of turning coffee into theorems, so in his case plotting ‘gallons of coffee’ (considering caffeine, metaphorically, to be information) against ‘number of theorems proved’ might have worked as a first pass.
My graph above reflects throughput patterns within my particular style of academic engineering research in modeling and simulation during that particular period (I was a postdoc at Cornell during this time). Coffee at Stella’s got transformed into written notes. Notes got transformed, in this case, into computer code with which I ran experiments, which produced data files. The data then got transformed to research output documents (papers and presentations). Here’s how I measured this throughput, each artifact in its own unit, with the graphs scaled so that the cumulative total at the end of the year is 1 (since we don’t care about absolute numbers when comparing apples and oranges) :
- NOTES: The cumulative number of pages in my research notes files. This is the best measure of “ideation” activity I could find.
- CODE: The megabytes of code and data in my working programming folders. This is one coarse measure of the amount of actual “work” being accumulated in computing work (today, I’d use a code repository and count check-ins)
- WRITING: The megabytes of working documentation in my computer “research” project folder. This measures the rate at which the “work” in 2 is being converted to completed output such as “papers” or “presentations”
- MGMT: This graph shows the accumulation of GTD data, or “overhead,” more on that in a bit, since this graph “measures” the others in a sense.
You can ponder the particular shape of the graphs (clearly my research style that year followed a classic research pattern of ideation, unstructured execution, structured execution, rather heavy on front-end ideation — I read and thought for almost 8 months before writing a line of code), but the broader points to take away are:
- Calibrating flows of information work requires an ethnographer’s eye for local detail and narrative, combined with a data-miner’s enthusiasm for diving in and examining the concrete artifacts of information work.
- You do have to actually look at real data, at least loosely. Sketching out graphs like the ones above hypothetically, based on your memory, or guessing based on how you think you work, measures your assumptions and biases, not your work.
- Some people seem to have the discipline to maintain things like food diaries and other real-time journals of what they did. I don’t, so I adopted a leave-footprints-and-backtrack model (saving dated copies of working computer folders, which I then data-mined manually).
Whatever you do, occasionally, you need to go through some sort of calibration exercise to get a data-driven sense of what your work looks like at the ground level. Without your sense of your work grounded in reality, the meta-feedback systems like GTD won’t work well. You don’t have to be as maniacally detailed as I was (I was doing this out of research curiosity, not because I am a life-hacker), but you do need to listen to your work.
Note that this exercise is NOT the same as the GTD-Sweep. Sweeping is about generating and getting meta-data about work into meta-systems. Calibration is about understanding the relationship between raw work and metadata about it.
Why Measurement Matters
In a previous article on information overload I used the metaphor of the Vegas buffet. Just because there is more food than you can eat, you don’t need to overeat. You just need to eat enough to satisfy your needs. But people still do overeat, and Brian Wasnick provided the most compelling reason why in his account of the psychology of eating, Mindless Eating: poor feedback control. On the measurement side, you overeat because you measure the wrong things (how much you have left on the plate for example, or whether your dinner companion has stopped eating). Let’s apply the same logic to information.
Yesterday I had over a thousand articles in my Google Reader. Today I have none. I got to this insane level of information-processing productivity using the magic “Mark all as read” button.
The reason: I am currently “full.” My throughput systems for all my projects are currently full enough of goal-directed work flowing through, as well as maximum-capacity reactive work in response to opportunities/threats, that I have no bandwidth left for any more. Yes, a high-priority development could bump my top priority items off, but my stuff is currently at a critical enough level that I can take the calibrated risk of missing key information.
In other words, yeah, there might be a tray of chocolate cake I didn’t spot in the buffet, and potentially, some salmonella in what I am already digesting, but there is little enough I can productively do about either possibility. So I can ignore the buffet.
The point of meaningful, well-calibrated measurements is that they can tell you how much work capacity you actually have. While information workers, as David and his trainers note, on average may have 50-60 projects as defined by GTD, the spread can be significant, and even for 2 people with the same number of active projects, one might be within capacity, based on the nature of the work, and the other might be teetering on the edge of madness.
From Calibration to Feedback: Measuring Meta Work Throughput
All information work is different, but information meta-work comes in surprisingly few varieties. By this, I mean collateral information that you use to keep track of your information work. The only condition is that you have to have some visible system. If it’s all in your head, the only thing you can use is subjective self-assessment of mental stress on a scale of 1-10 (you can measure that using a rather heavy-weight technique called experience sampling). But if you have something even as basic as a to-do list, you can measure meta-work, which is much simpler than either measuring the contents of your head or your ground-level work.
Remember, this is only useful if you also have good calibration with respect to your ground-level work. Otherwise you won’t be able to meaningfully understand your meta-work measurements.
Note from Figure 1, that I only have measurement data for part of the period, when I was actually being structured in my work habits. In research, you tend to swing between more and less structure.
Like I said, meta-work comes in few varieties, and mostly uses the same artifacts: lists and calenders. During the organized part of my two odd years, I was using GTD in a fairly disciplined way, but you can do something like this with any reasonable system so long as it is plugged into enough of your life, and has some meaningful semantics (measuring your grocery shopping list length every week is obviously silly — that’s only a small sideshow of your life).
Since most of the readers on this site have a familiarity with GTD, you don’t need the 101 version. Besides the main GTD lists and calendar, I also had two special-purpose lists called Job Search and Course (for a course I was teaching for part of the time).
Here’s what the action looked like (this is effectively a drill-down into the MGMT part of Figure 1.)
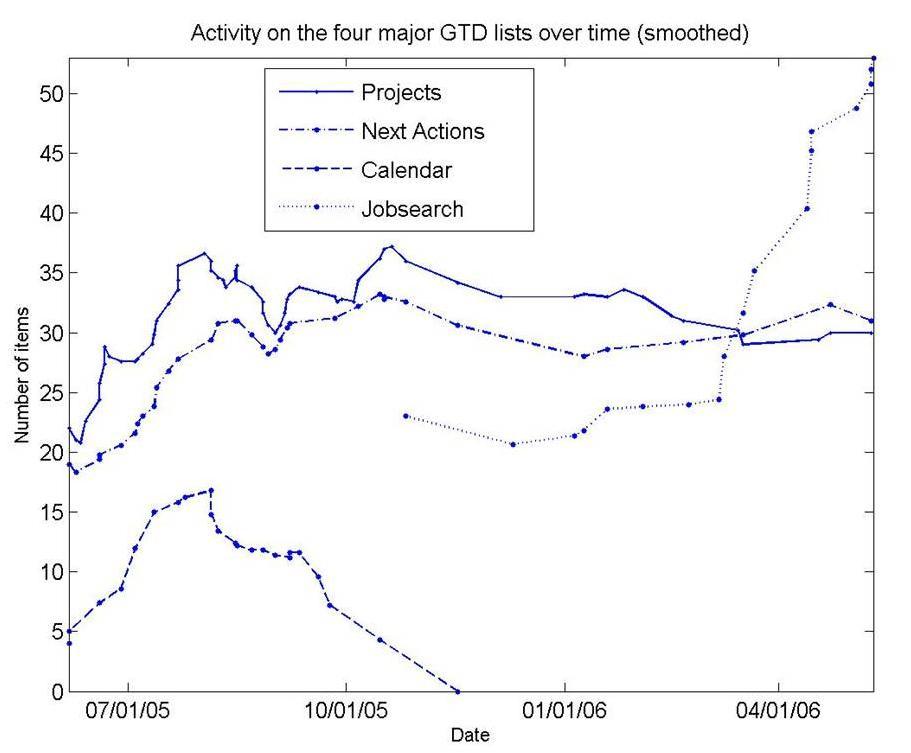 Figure 2: Meta-Work Trends for GTD system
Here are some highlight points for you to ponder:
- The number of next-actions stays fairly constant after an initial upswing as ‘collection’ habits become more efficient.
- This coarse look at the data does not reveal ‘task churn’ – the addition and deletion of tasks, a typical list-re-edit changes something between one task to a third of the entire list.
- Note that during the first half, calendar activity is present, but this vanishes in the second half. Like many full-time postdoctoral researchers, my “hard landscape” of calendered activities was mostly completely empty when I was not teaching. Barring meeting with students at scheduled times, I rarely had any time constraints. A busy MD’s data would look very different, with a lot of calendar activity.
- I got married on August 12, 2005 and moved into a new apartment on August 14 and 15 – the time coincides with the peak in calendar activity. Around that time, I was also submitting several papers to conferences and getting started with new students for Fall.
- Note that the activity on both the Next Actions and Projects lists tails off in the second half, but a special list (my Job search list) is very active and growing.
The key point to note is that this sort of measurement is trivially easy to do. I maintained all my lists in my email, and whenever I made a change, I’d save the old list in a folder and email myself the new one, which stayed in my Inbox. A meta-point: you wouldn’t be able to come up with such highlight observations without calibration. Staring at GTD data with no companion data about ‘ground’ reality is not very useful for introspection.
Understanding Churn
Churn in the meta-data of your life represents throughput at the ground level of your life. Here is one view of the churn from my data:
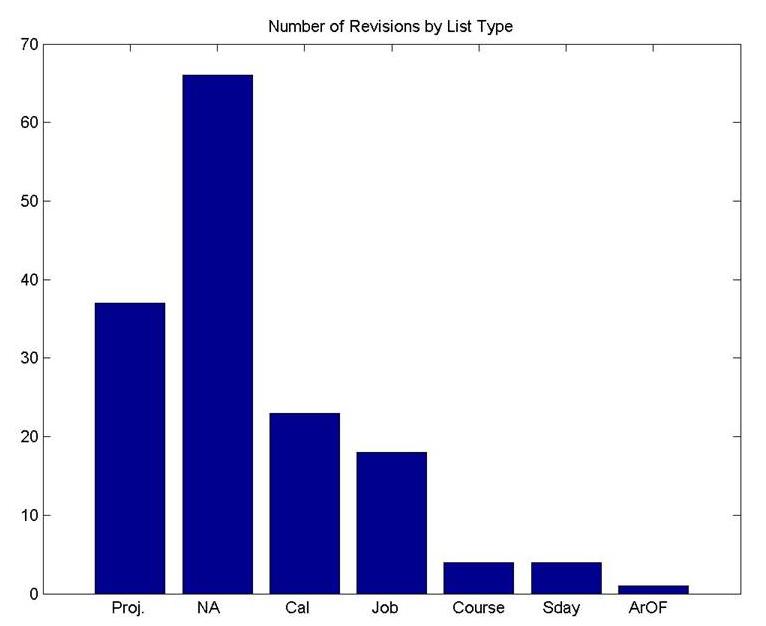 Figure 3. Measuring churn in your life
To understand how churn in your meta-data maps to productivity in your ground-level data, you need to analyze and interpret. In this case, you see the profile of a fairly healthy execution-oriented phase of my life, with very little questioning of Big Life Priorities. My Areas of Focus list was barely touched. I clearly was focused on the now rather than the future, since there was little daydreaming showing up as someday/maybe.
I got these graphs through some laborious data entry, going through all my saved historical lists, but for real-time feedback, most of the time you actually need very little information — you just need to keep one eye on the length of your lists, another on the amount of churn, and a third (yup, GTD implementers need to be 3-eyed!) on whether your systems need recalibration with respect to your ground-level work. Is most of your work next year going to be about managing people when most of it this year was about programming? Do 50 projects represent the same load for a people manager as for a programmer? You won’t know till you try some recalibration, and reflect on what your work felt like, as you stare at your GTD graphs and your “raw work measurement” graphs side-by-side.
Measurement, Control and Information Overload
Let’s bump back up to the theme of information overload and how the idea of measuring your work relates to it.
The connection is simple. If you have a good, noise-free and accurate sense of what’s going on with your work, in a throughput sense, you’ll have a very accurate idea of how much information you need, of what sorts, and when.
This will give you the confidence to control the flow. You have always had the ability (ranging from the nuke/delete all/mark-all-as-read buttons, to more selective filtering tools), but it is the confidence and trust in your sense of the state of your work that will give you the courage to use the levers available to you. Focusing on the efficiency of filtration/recommendation systems is pointless — the state of the art is good enough already in most ways. The real bottleneck is the inefficiency of measurement on the demand side.
Of course, this has been a story told around some selected highlights of a complex period of my life, so there is a lot I didn’t tell you, but a word to the wise is sufficient. Look inward at your work-hunger before you look outward at the information buffet out there.